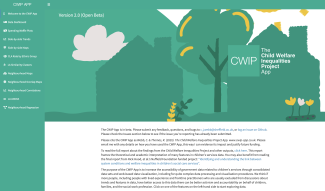
The Child Welfare Inequalities App

The CWIP App brings together around 16 different datasets at the local authority and neighbourhood level, with a range of features including being able to adjust for deprivation effects using the results from linear models calculated ‘on the fly’; the ability to compare multiple different graphs side-by-side; and the possibility to create literally hundreds of thousands of possible graphs.
The Data Dashboard allows you to quickly look at trends in variables from Section 251 returns, Children Looked After statisticshttp://calumwebb.uk/posts/cwip-app-v2-launch/ and the Children in Need Census
The purpose of the app is to help social workers, policymakers, local government, activists with the task of representing trends and patterns in, and pulling out basic statistics from, children’s services data.
